DeepSeek V3/R1 Inference Efficiency (2): Reverse-Engineering the Production Deployment
Originally published in Chinese on Zhihu, March 24, 2025.
This is part 2 of 3
Part 1 estimated a throughput ceiling from the V3 paper alone. This part rebuilds the estimate against everything DeepSeek has since published. Part 3 generalizes the result to other configurations.
Updates
Mar 21 — DeepSeek published decoding.json. Reading the MoE layers, a single MoE layer across two microbatches runs about 714 × 2 = 1.4 ms, with end-to-end around 87–96 ms; efficiency is slightly above MTP=1. The overlap structure and the layer-by-layer profiling method are the same as below, so the numbers here are left as they are.
Mar 16 — Updated the decode BMM profiling figures.
1. Introduction
The qualitative estimate in part 1 drew more interest than expected, along with a number of questions. As an exercise in bounding the problem it did its job — it ruled out some wildly optimistic ceilings — but as an estimate of DeepSeek R1's performance, now that the timeline data is public, it was too coarse. Two methodological problems:
a) Whether the bound is attainable
Taking compute and communication together, without MTP, R1 on EP256 H800 in FP8 has a per-GPU ceiling of 3300 tokens/s (BF16 combine) to 5000 tokens/s (FP8 combine); H20 sits around 1600 tokens/s.
Writing per-GPU throughput as
- On H800, if communication cannot be fully hidden behind compute (that is,
), then is unreachable and the attainable bound is set by . - On H20, even though
, MFU losses still apply: attainable throughput is , where MFU is governed mostly by the efficiency of the non-communication operators.
b) Computing the expert saturation point
Part 1 used
- No full FP8 GEMM curve had been measured, so the saturation point could be substantially off.
- It ignores what grouped GEMM does for TFLOPS. Assuming
presumes a single expert GEMM can saturate the GPU, which overlooks the SM-utilization gain grouped GEMM provides when individual GEMMs are small. That inflates the estimate of the device count , and forecloses the question most practitioners actually care about — whether a smaller EP group achieves the same effect. - With grouped GEMM,
should be a function of group_numberandm_per_group, which are themselves tied to theon the left-hand side.
This post therefore works from everything DeepSeek has published — FlashMLA, DeepEP, DeepGEMM, profile-data, and the V3/R1 inference system overview — to reverse-engineer the EP144 deployment reasonably completely.
This post no longer distinguishes V3 from R1, instead using the average distribution from the inference-system overview. Aligning to the official figures means correcting two coarse assumptions from part 1:
- The shared expert is replicated on every device, rather than distributed redundantly across separate nodes as under EP320.
- Expert redundancy is accounted for: both prefill and decode use 256 routed experts plus 32 redundant experts.
The key figures DeepSeek published:
- Prefill — routed experts EP32, MLA and shared expert DP32; one deployment unit is 4 nodes, with 32 redundant routed experts, 9 routed experts and 1 shared expert per GPU.
- Decode — routed experts EP144, MLA and shared expert DP144; one deployment unit is 18 nodes, with 32 redundant routed experts, 2 routed experts and 1 shared expert per GPU.
- 608B input tokens total, of which 342B (56.3%) hit the KV cache on disk.
- 168B output tokens total. Average output rate 20–22 tps; average KV cache length per output token, 4989.
- Average per-H800 throughput: prefill about 73.7k tokens/s input (including cache hits); decode about 14.8k tokens/s output.
2.1 Average prefill/decode lengths
Following the method raised in the comments on part 1:
Let
be the average input length and the average output length. Then the average KV cache length per output token is roughly ; combined with , this gives and .
So
2.2 Average prefill/decode instance counts
For balanced prefill/decode consumption, consider the ratio of 4-node prefill instances to 18-node decode instances. With
- Working back from total input throughput, concurrency is about
nodes. - Working back from total output throughput,
nodes.
That gives
2.3 Prefill analysis
From the prefill timeline settings, prefill uses a 4k prompt with 16k tokens per GPU across 2 microbatches. So a single microbatch has
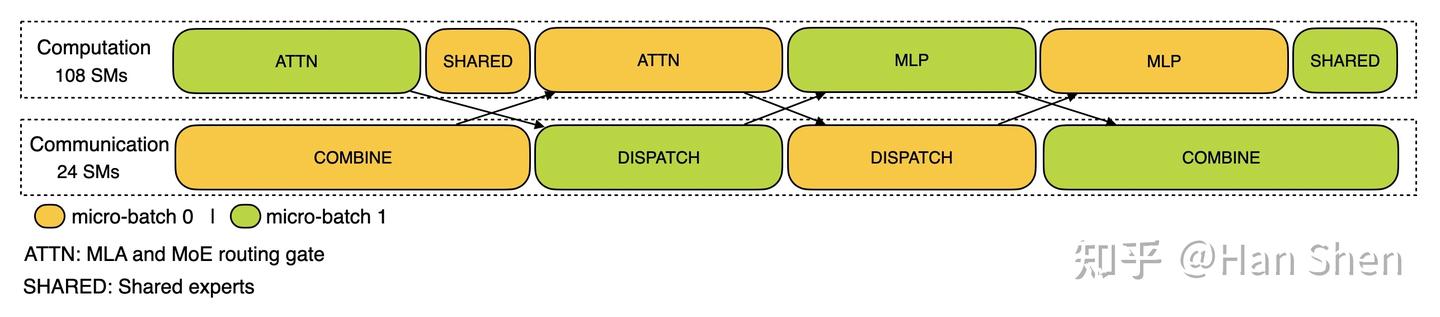
DP-32, EP-32 prefill two-microbatch overlap timeline
2.3.1 Per-layer profiling, single prefill microbatch
Compute
A rough sketch of prefill MLA — the notation abuses part 1's slightly, but the correspondence should be clear:
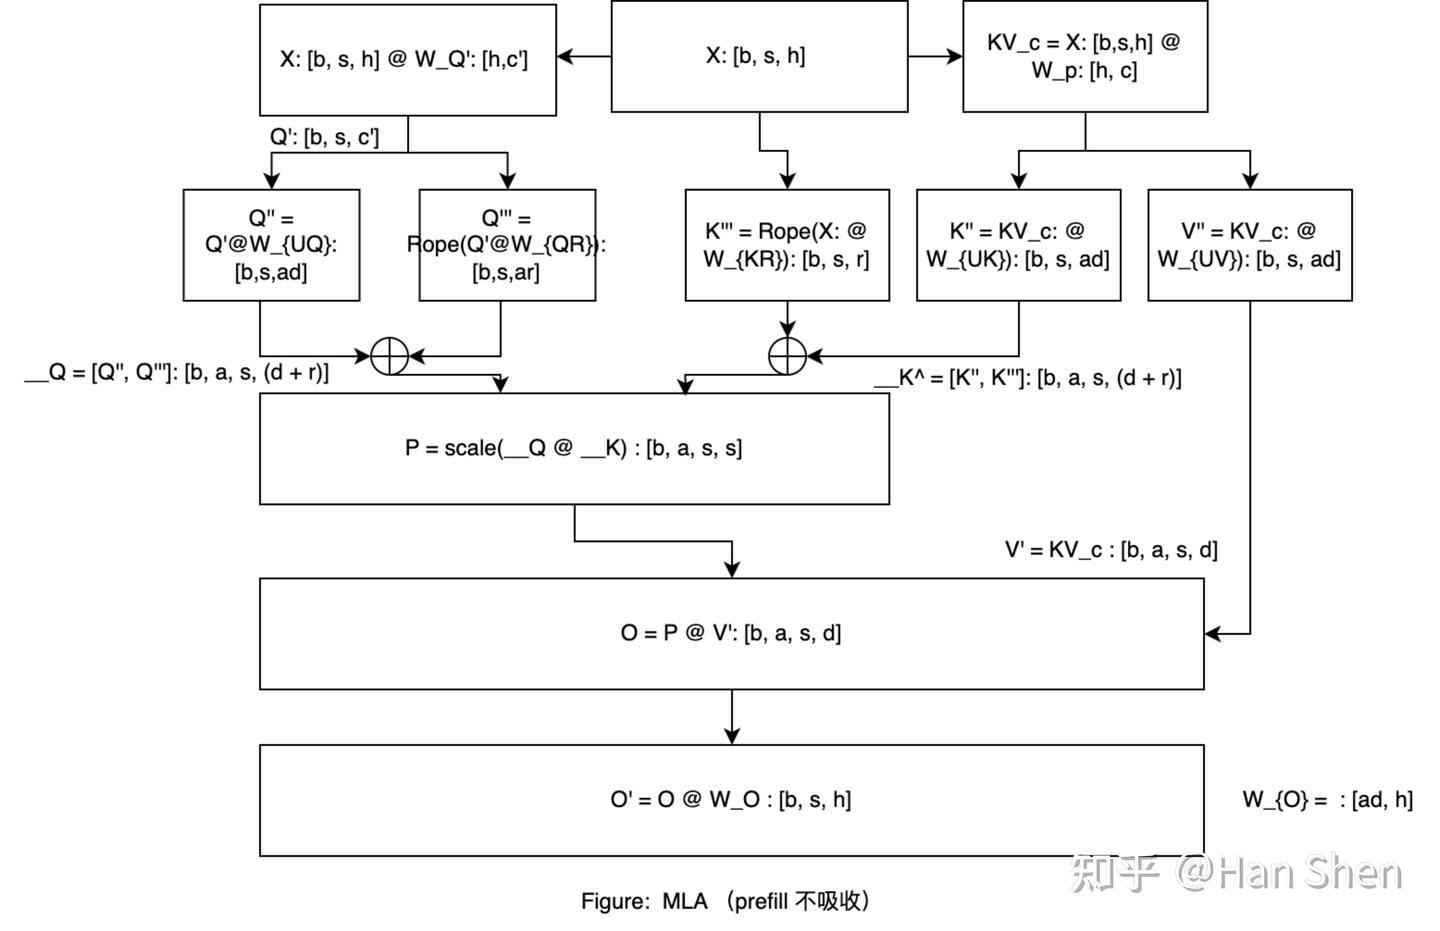
- QKV projection
: GFLOPs : GFLOPs : GFLOPs
- MLA (MHA) attention
: (causal) GFLOPs : (causal) GFLOPs
- O projection
GFLOPs
- Routed expert GEMM —
group_number= 9,m_per_group=- Up & gate:
GFLOPs - Down:
GFLOPs
- Up & gate:
- Shared expert GEMM
- Up & gate:
GFLOPs - Down:
GFLOPs
- Up & gate:
Communication
With only 4 machines, the network estimate follows the intra-device deduplication scheme discussed earlier: across 4 nodes, each token sends at most 3 copies outward.
- Dispatch (per layer):
MB - Combine (per layer):
MB
With FLOPs and traffic in hand, here is the timing analysis of prefill.json:

Actual prefill timeline overlap
Per-layer, per-microbatch duration and TFLOPS
To enable overlap, 108 SM cores are used for compute and 24 for communication. GEMMs give up 10–20% of MFU relative to running exclusively.
| Compute | Shape | GFLOPs | Duration (µs) | TFLOPS |
|---|---|---|---|---|
| [7168, 2112] | 248 | 268 | 925.5 | |
| [1536, 24576] | 618.5 | 922 | 670.8 | |
| [512, 32768] | 274 | 533 | 515.7 | |
| MHA attention | 1392 | 2683 | 519 | |
| O projection | [16384, 7168] | 1924 | 1652 | 1164.7 |
| Shared up & gate | [7168, 4096] | 481.04 | 439 | 1095 |
| Shared down | [2048, 7168] | 240.5 | 306 | 786 |
| Routed up & gate | [7168, 4096] | 3848.3 | 3534 | 1089 |
| Routed down | [2048, 7168] | 1924 | 2381 | 808 |
| Communication | Traffic (MB) | Duration (µs) | Bandwidth (GB/s) |
|---|---|---|---|
| Dispatch notify | 743 | ||
| Dispatch all-to-all | 168 | 4326 | 38 |
| Cache notify | 788 | ||
| Combine all-to-all | 336 | 8845 | 37 |
| Other (3004 µs in total) | Duration (µs) |
|---|---|
| Attention: add & LayerNorm & RoPE | 549 |
| Attention: BF16→FP8 for O projection | 232 |
| Gate: router gate & prepare shared GEMM | 529 |
| Expert: prepare routed GEMM | 728 |
| Expert: SwiGLU | 314 |
| Expert: combine reduce | 594 |
Principal compute time: 12.7 ms.
| GFLOPs | Duration (µs) | Model TFLOPS | MFU | |
|---|---|---|---|---|
| GEMMs + attention (SM 108) | 10950 | 12718 | 861 | 44% |
| GEMMs + attention + memory ops (SM 108) | ~10950 | 15722 | 696 | 35% |
2.3.2 Per-GPU prefill throughput
From the timeline. A full prefill forward pass takes about 2118 ms, i.e.
Against the theoretical figures:
- At 38 GB/s of communication bandwidth,
tokens/s. - At peak compute,
tokens/s, of which the attained figure is tokens/s. So when MFU is low, becomes the tight bound on throughput.
From production data. Per-GPU prefill throughput is roughly
Conclusion. DeepSeek's peak prefill throughput under balanced load reaches 7735 tokens/s. The 4k tokens/s implied by the averaged production figures reflects a full day of peaks and troughs — periods when the system is not saturated, or when imbalance prevents full overlap.
2.4 Decode analysis
DeepSeek has not published an EP144 decoding timeline, so the decode profiling here comes from measurements of DeepGEMM and FlashMLA plus a small amount of estimation.
Take per-GPU
Under DP144-EP144, each routed expert receives on average m_per_group = 256, with group_number =
2.4.1 Per-layer profiling, single decode microbatch
Decode uses absorbed MLA, which differs slightly from prefill. (The absorption diagram has been updated: per the SGLang implementation, the purple section is a BMM rather than an ordinary post-absorption linear. The BMM is currently modelled with torch.bmm in BF16, scaled by a factor of 1.7 to approximate FP8 BMM performance; the profiling figures below have been updated accordingly.)
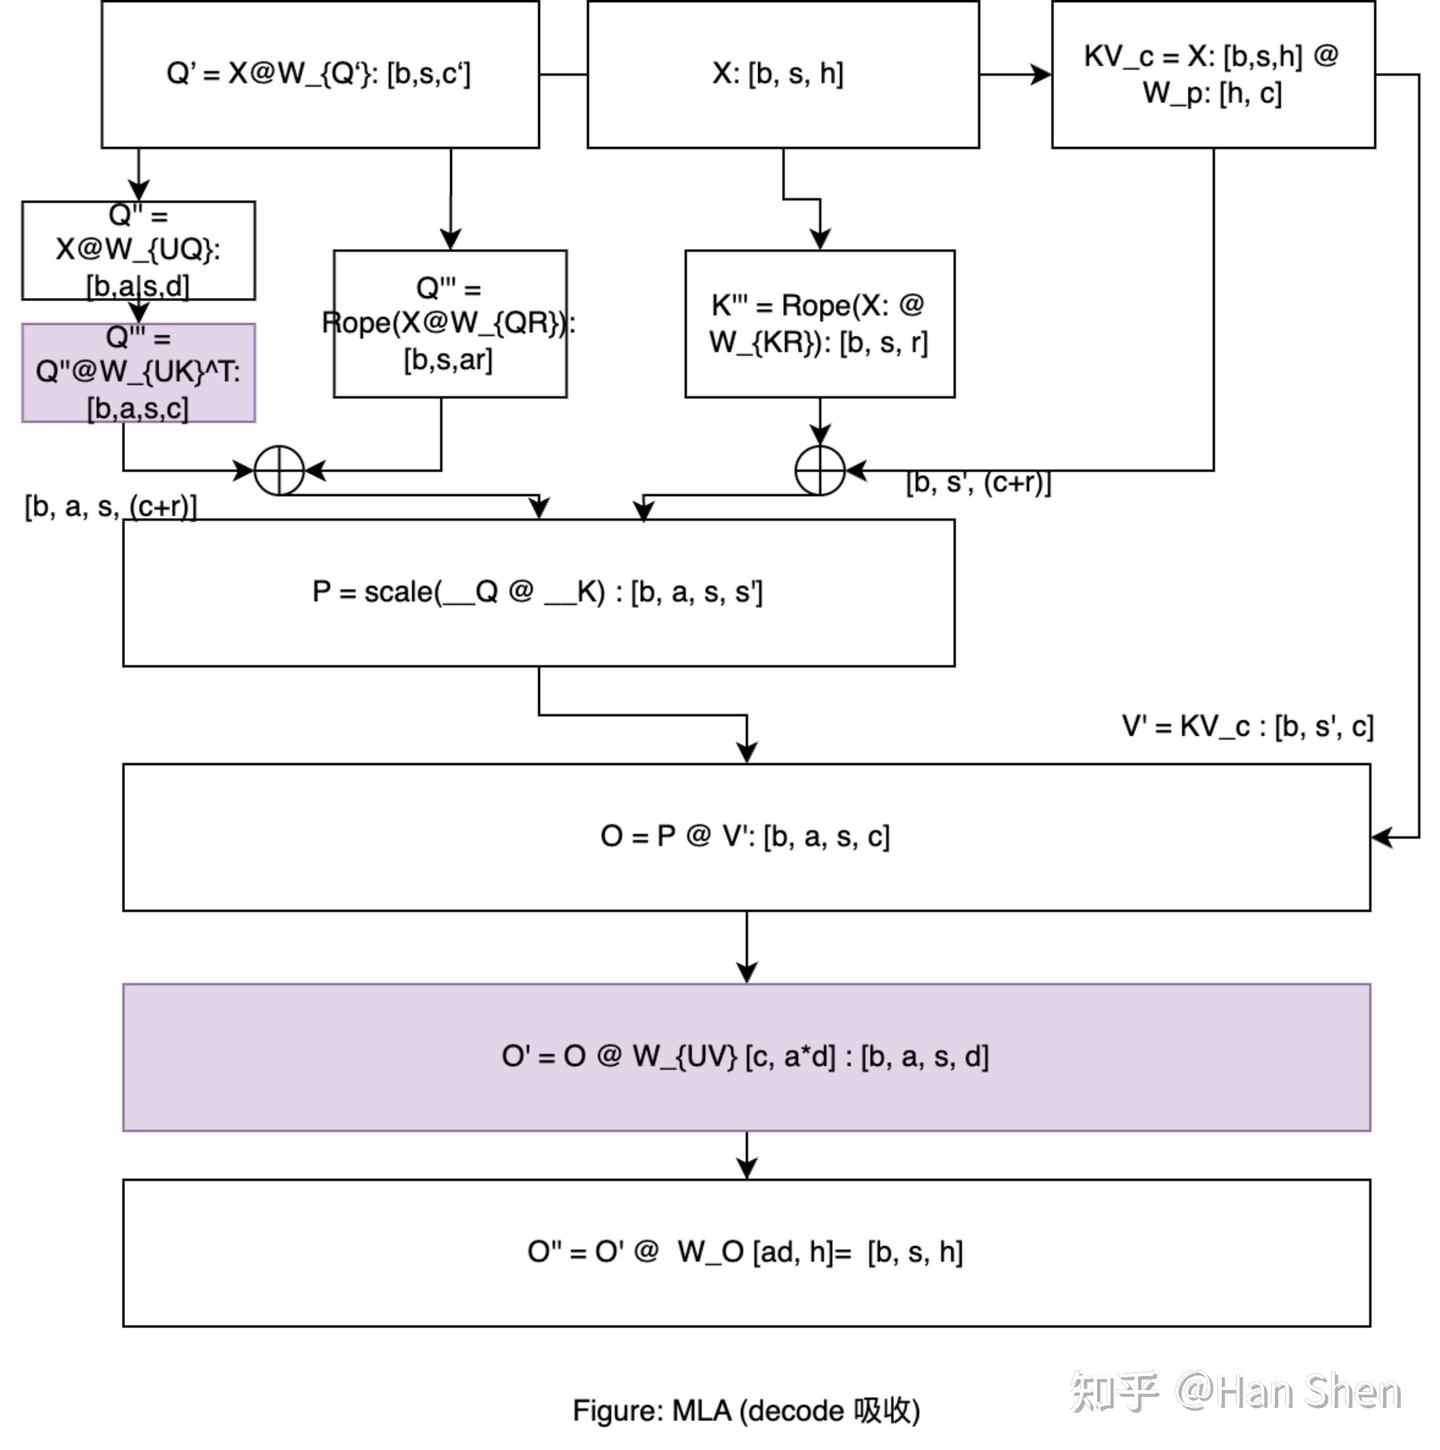
Compute
- QKV projection
: GFLOPs : GFLOPs : GFLOPs
- MLA/MQA attention
: GFLOPs : GFLOPs
- O projection
: GFLOPs projection: GFLOPs
- Routed expert GEMM —
group_number= 2,- Up & gate:
GFLOPs - Down:
GFLOPs
- Up & gate:
- Shared expert GEMM
- Up & gate:
GFLOPs - Down:
GFLOPs
- Up & gate:
Communication
Decode node counts will not be small, so assume 8 or more machines. Estimating the network ceiling under the least favourable pattern — sending to 8 other nodes, so at most 8 copies per token:
- Dispatch (per layer):
MB - Combine (per layer):
MB
Memory-bound operator durations are scaled from the prefill figures in 2.3 in proportion to token count, which is reasonable under a bandwidth bound. For router gate and prepare-shared-GEMM, for instance:
Context length uses DeepSeek's actual
| Compute | Shape | GFLOPs | Duration (µs) | TFLOPS |
|---|---|---|---|---|
| [7168, 2112] | 1.94 | 10 | 190 | |
| [1536, 24576] | 4.83 | 17 | 280 | |
| bmm([128, bs, 128], [128, 512, 128]) | 1.07 | 10 | 112 | |
| MLA/MQA attention | 89.1 | 196 | 462 | |
| bmm([128, bs, 512], [128, 512, 128]) | 1.1 | 8 | 132 | |
| O projection | [16384, 7168] | 15 | 46 | 326 |
| Shared up & gate | [7168, 4096] | 3.76 | 14 | 270 |
| Shared down | [2048, 7168] | 1.88 | 7 | 258 |
| Routed up & gate | [7168, 4096] | 30 | 33 | 898 |
| Routed down | [2048, 7168] | 15 | 20 | 753 |
| Communication | Traffic (MB) | Duration (µs) | Bandwidth (GB/s) |
|---|---|---|---|
| Dispatch all-to-all | 3.5 | 88 | 39 |
| Combine all-to-all | 7 | 175 | 39 |
| Other (23 µs in total, estimated) | Duration (µs) |
|---|---|
| Attention: add & LayerNorm & RoPE | 4.29 |
| Attention: BF16→FP8 for O projection | 1.81 |
| Gate: router gate & prepare shared GEMM | 4.13 |
| Expert: prepare routed GEMM | 5.69 |
| Expert: routed SwiGLU | 2.45 |
| Expert: combine reduce | 4.64 |
Principal compute time: 350 µs.
| GFLOPs | Duration (µs) | Model TFLOPS | MFU | |
|---|---|---|---|---|
| GEMMs + attention (SM 132) | 164 | 361 | 454 | 23% |
| GEMMs + attention + memory ops (SM 132) | ~164 | 384 | 427 | 21.5% |
2.4.2 Per-GPU decode throughput
From the timeline. Without a complete timeline, decompose the decode duration:
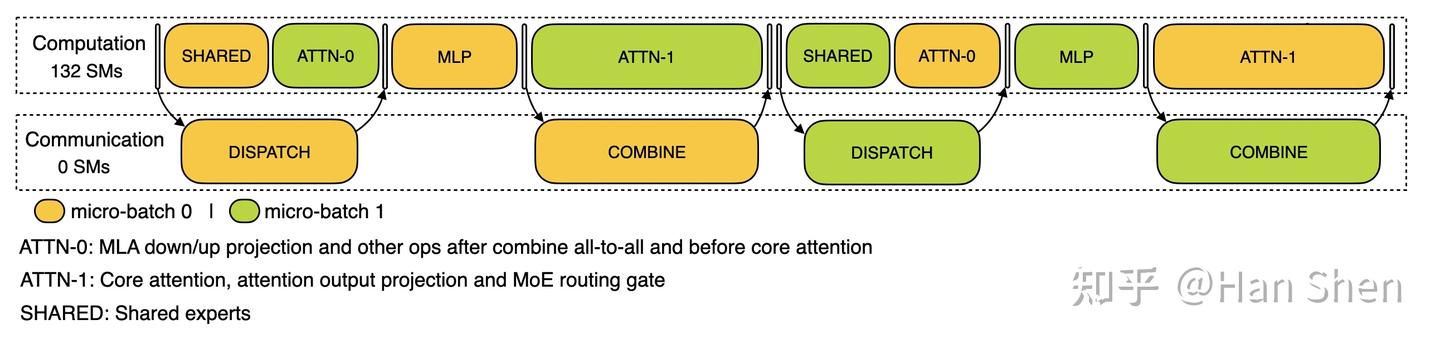
DP-144, EP-144 decode two-microbatch overlap timeline
- Shared + Attn0 — shared + MLA QKV GEMM + after-combine-reduce + before-core-attention:
µs < 88 µs. This does not fully hide the communication, so 88 µs. - MLP — prepare + routed GEMM + SwiGLU:
µs. - Attn1 — core attention + O projection + routing gate:
µs > 174 µs, which covers the combine, so about 255 µs.
A single layer's forward is therefore about
That puts TPOT at about 50 ms — roughly 20 tokens/s per user — with per-GPU throughput of
From production data. Per-GPU decode throughput is about
Conclusion. Peak decode throughput under balanced load reaches 2560 tokens/s; the 1850 tokens/s from the averaged production data reflects the daily peaks and troughs during which the system is not saturated.
2.5 Choosing the overlap scheme
The official pipeline diagrams show prefill and decode using different overlap strategies: prefill allocates 24 SM cores to communication, while decode consumes none.
Setting aside the IBGDA implementation differences introduced for latency, consider how to overlap communication with compute from first principles.
I take IBGDA to be primarily about achieving lower latency at small transfer sizes, which shows up in DeepEP as higher effective bandwidth. It does not change the overlap analysis.
For prefill, compute-intensive GEMMs dominate, so memory-bound operator costs can largely be ignored. Draw the single-microbatch dependency graph — the blue section — and the remaining problem is filling the bubbles left by dispatch (dispatch notify + all-to-all ≈ 5 ms) and combine (cache notify + all-to-all ≈ 9.6 ms). QKV + core attention + O projection takes about 6 ms, and the MLP about 5.9 ms — both close to the dispatch duration, with dependencies that stagger conveniently. The two-microbatch overlap below follows naturally; the shared-expert computation is moved to overlap with combine, to fill it as fully as possible.
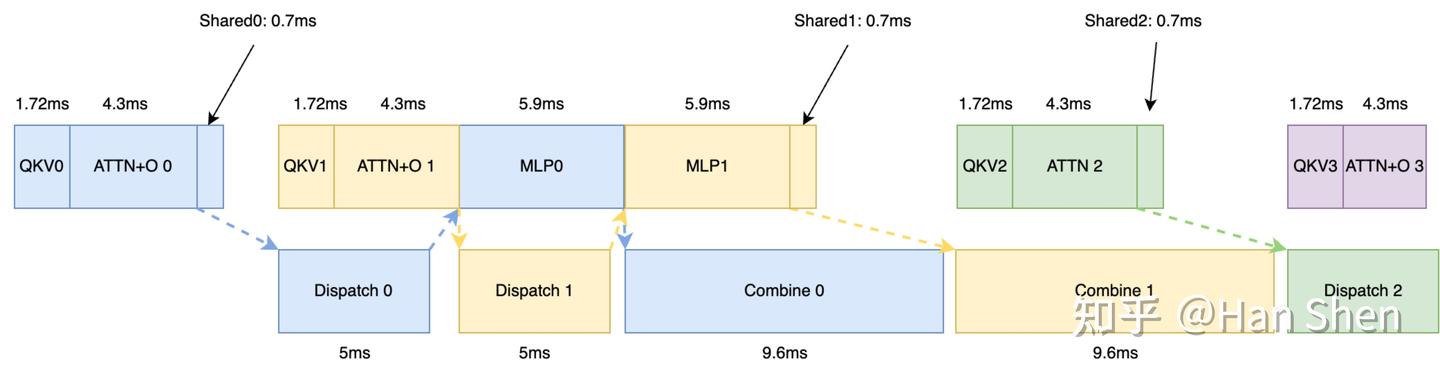
Prefill overlap
Decode GEMMs are all relatively small, so memory-bound operator costs cannot be ignored here. Writing:
- QKV (attention add & LayerNorm & RoPE + QKV GEMM) =
µs - ATTN + O + Gate (core MLA attention + O projection + routing gate) =
µs - Shared (prepare + shared expert GEMMs) =
µs — the gate is small enough that it is folded in here - MLP (prepare + routed GEMMs + SwiGLU) =
µs
Again, start from the single-microbatch dependency graph, in blue below.
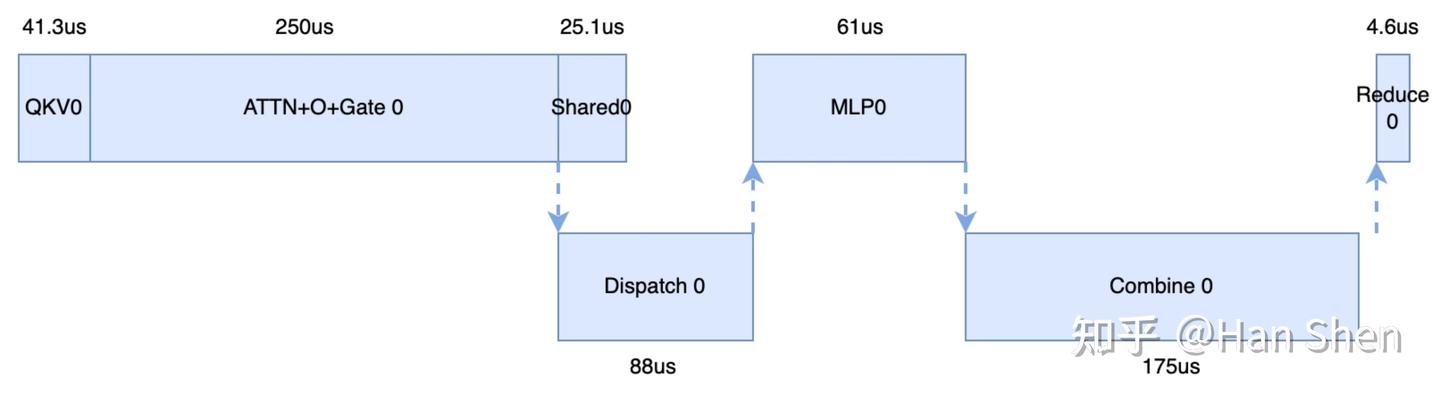
Core MLA attention dominates decode, so it can no longer be overlapped with dispatch; it should be overlapped with combine instead. That gives the scheme below, which matches the one DeepSeek published.

3. Conclusion
That is a reasonably complete decomposition of what DeepSeek has published. The generalization to other configurations turned out to be too much material for one post; it is the subject of part 3.